Introducing the Splunk Add-On for Octopus Deploy
It’s no secret to those who know me well, I enjoy the delight of a seamless deployment. The team over at Octopus Deploy have toiled for a number of years developing a tool and educating the wider .Net community about the benefits of a repeatable deployment.
Another aspect of tech I love, is structured logging. In particular the detailed visibility it provides into our solutions and what they are really up to. One of my favourite tools that I have been fortunate to work with and utilise is Splunk.
I have spent a fair amount of time, primarily with developers illustrating the benefits of a wholistic view of solutions, not just relying on some dodgy flat file.
For those new to Splunk, it is a intelligence platform that originally made its name in the operational security space. Since then its strong architectural design has allowed it to expand its focus to a wider range of uses. It shares many traits with GrayLog and ELK, with the former using Splunk as a starting point for its architecture.
So with my success in past projects and an ever increasing focus on operational security (Thanks to OJ) I decided to mash out this add on.
Ok… so what is it? Primarily, it is a simple way to get your release and deployment information into Splunk to augment with your existing organisational data.
First, you will need an API Key from Octopus. Once the app is installed you then can configure a data input just as you would any other (it is a Node.JS add on).
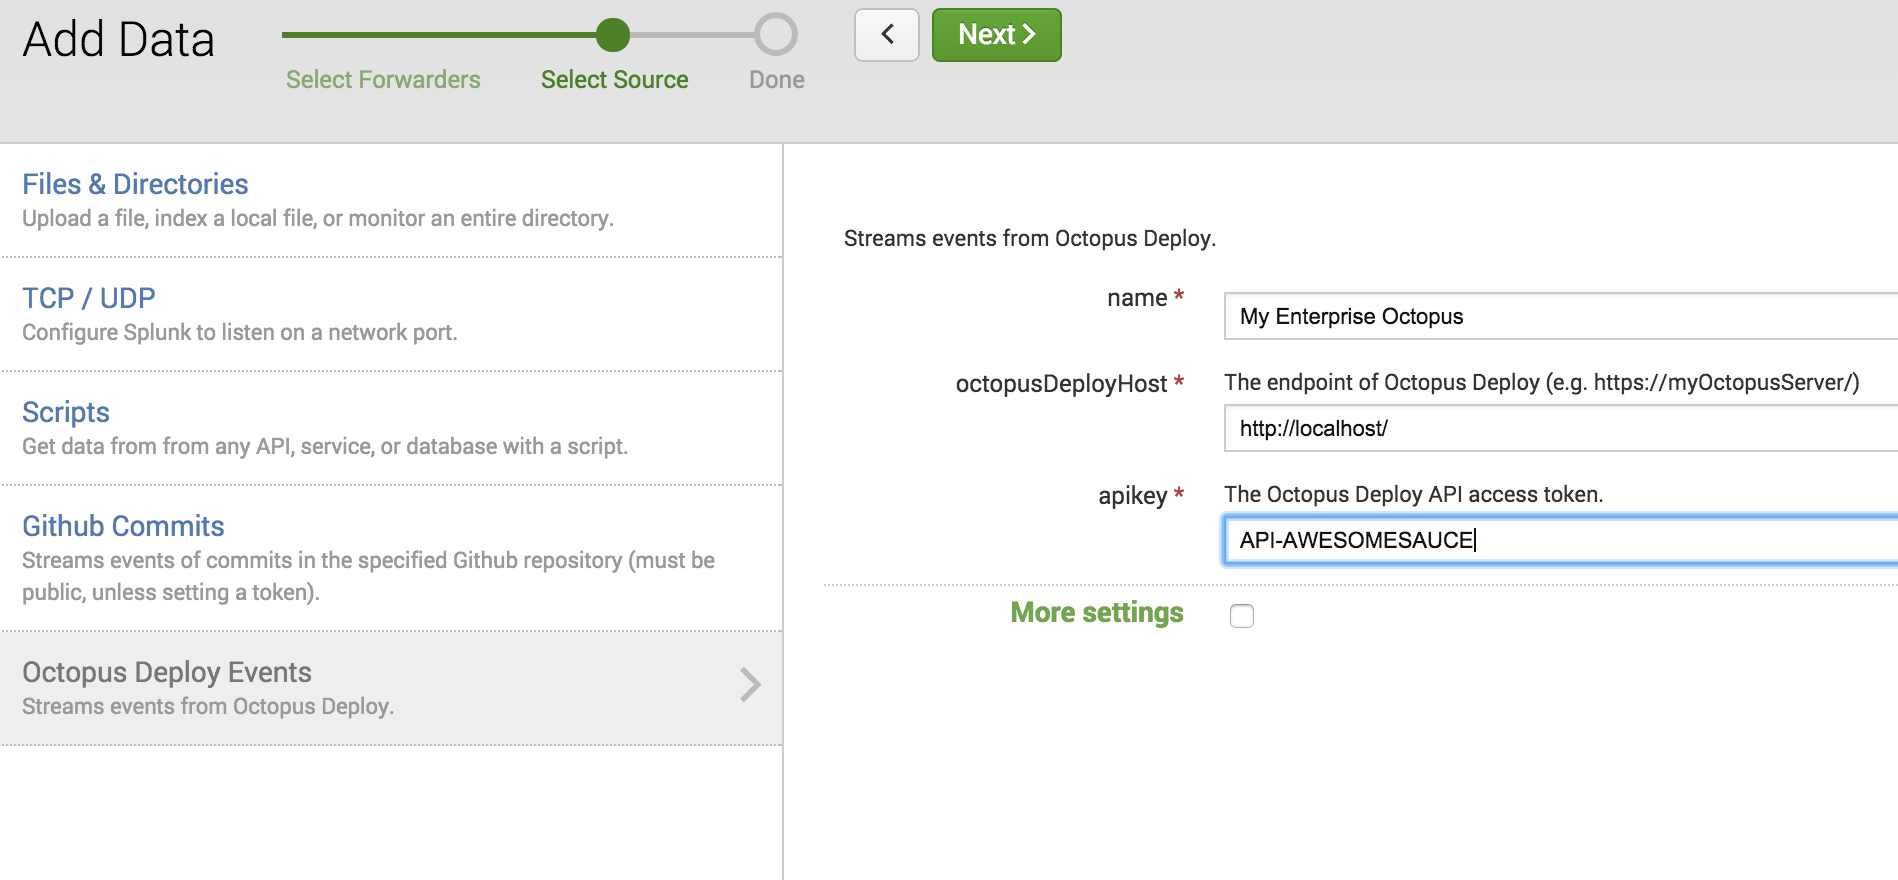
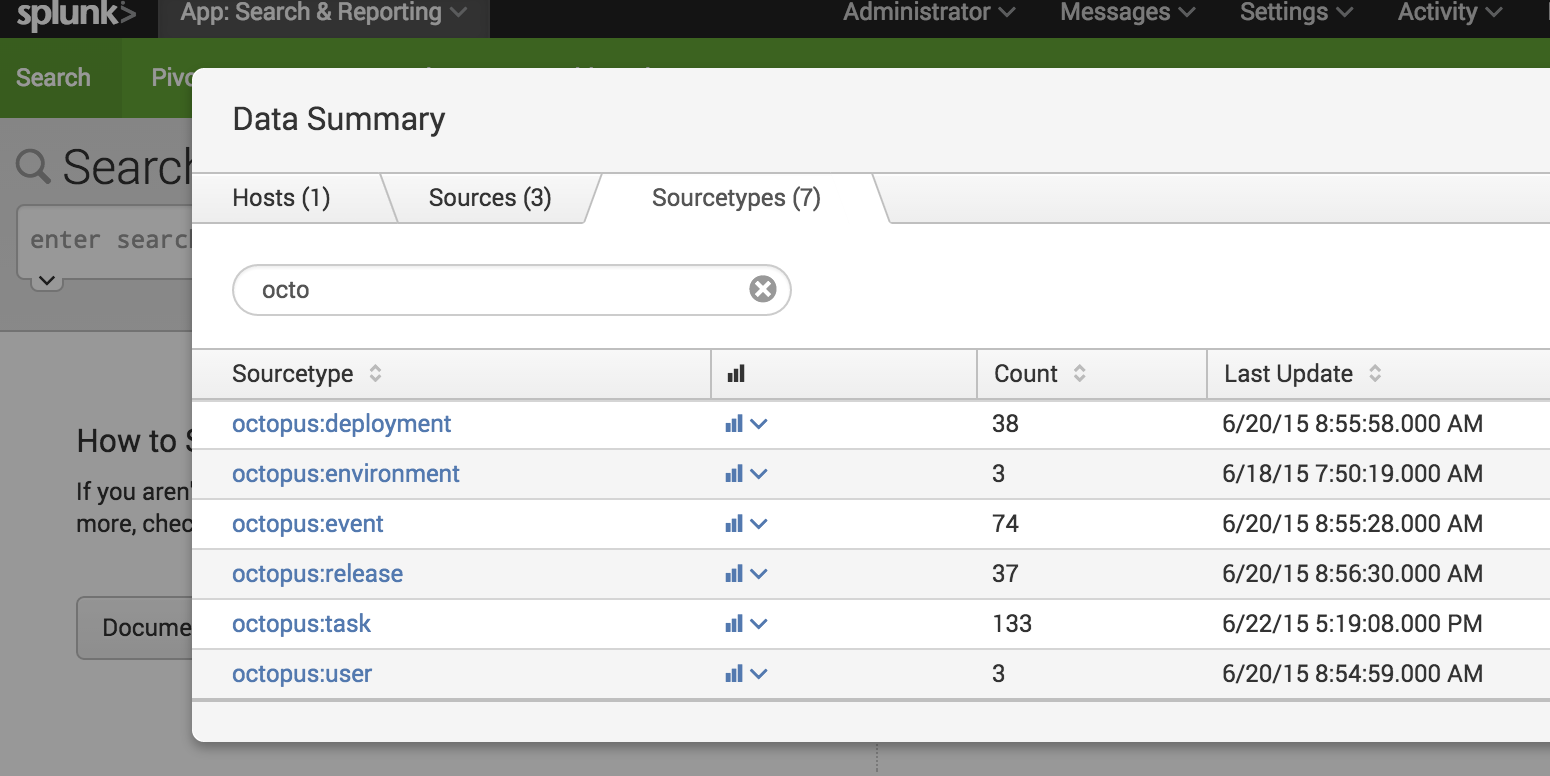
Once that is done, you can search using the following source types:
- Users :
octopus:user - Tasks :
octopus:task - Events :
octopus:event - Deployments :
octopus:deployment - Releases :
octopus:release - Environments :
octopus:environment
This is just an initial list of source types that will get extended over time. In the search app, it looks like this.
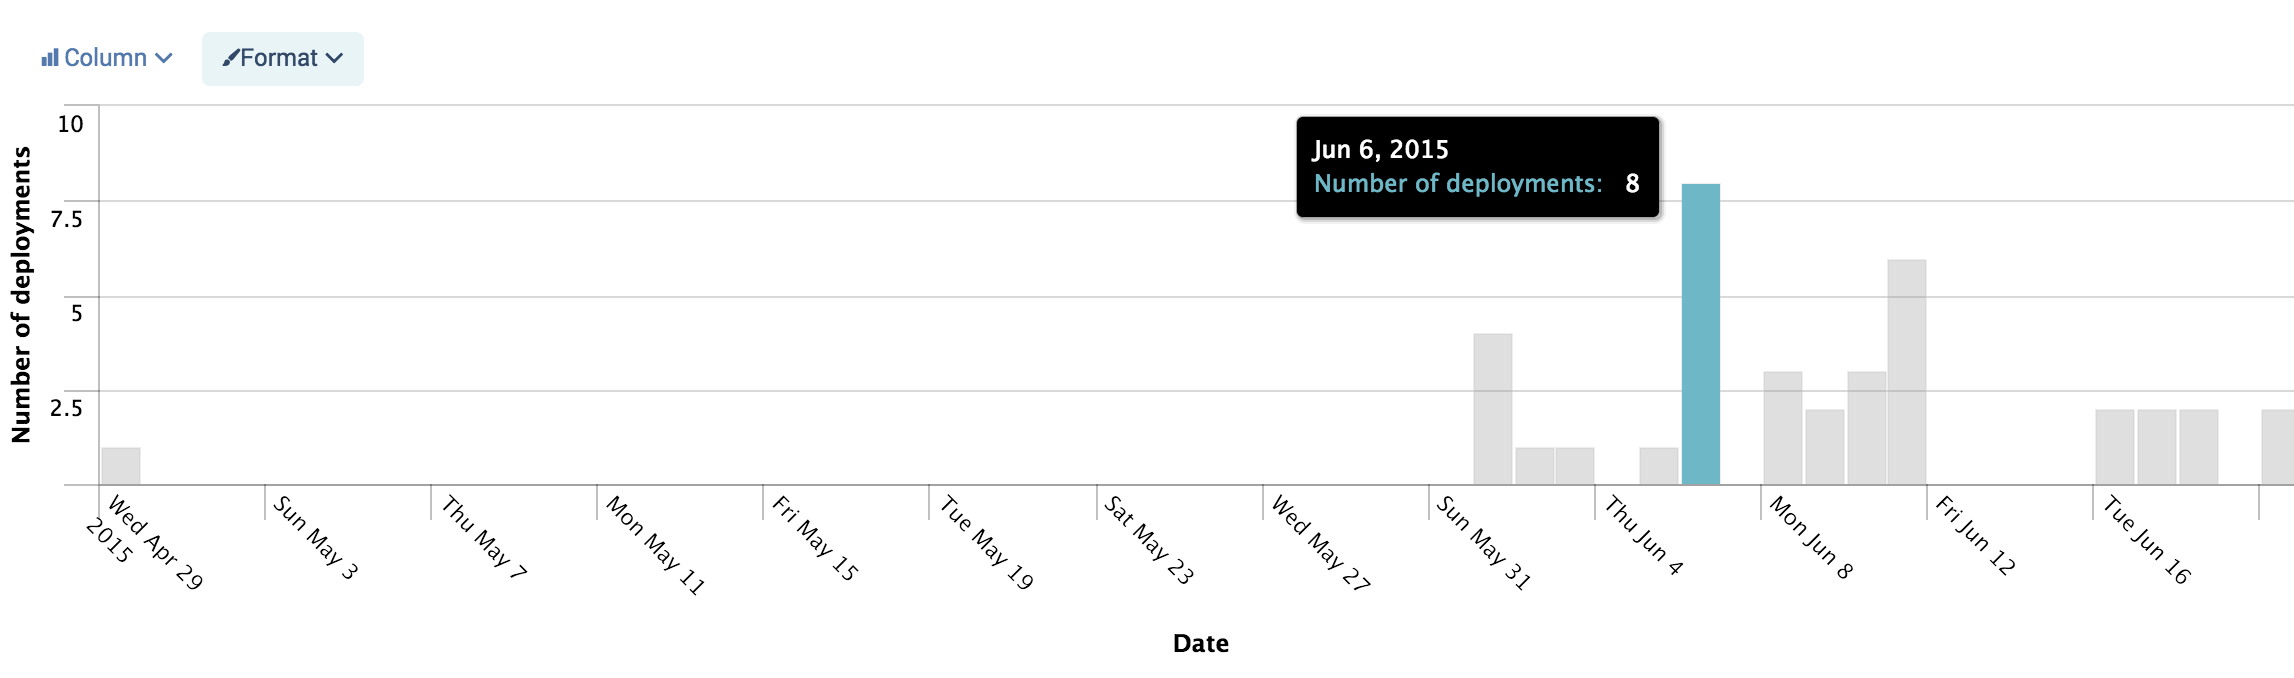
Given the sources above you can pull in some simple metrics that are available in the Octopus Deploy product. These examples simply utlise the data streamed from Octopus Deploy.
Deployments over time
sourcetype="octopus:deployment" | timechart count(Id) as "Number of deployments"
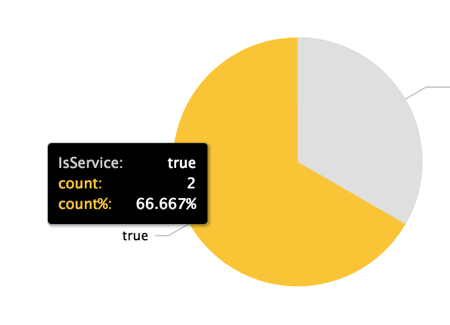
Active Users by Type (IsService)
sourcetype="octopus:user"| spath IsActive | search IsActive=true | stats count by IsService
Deployment Duration
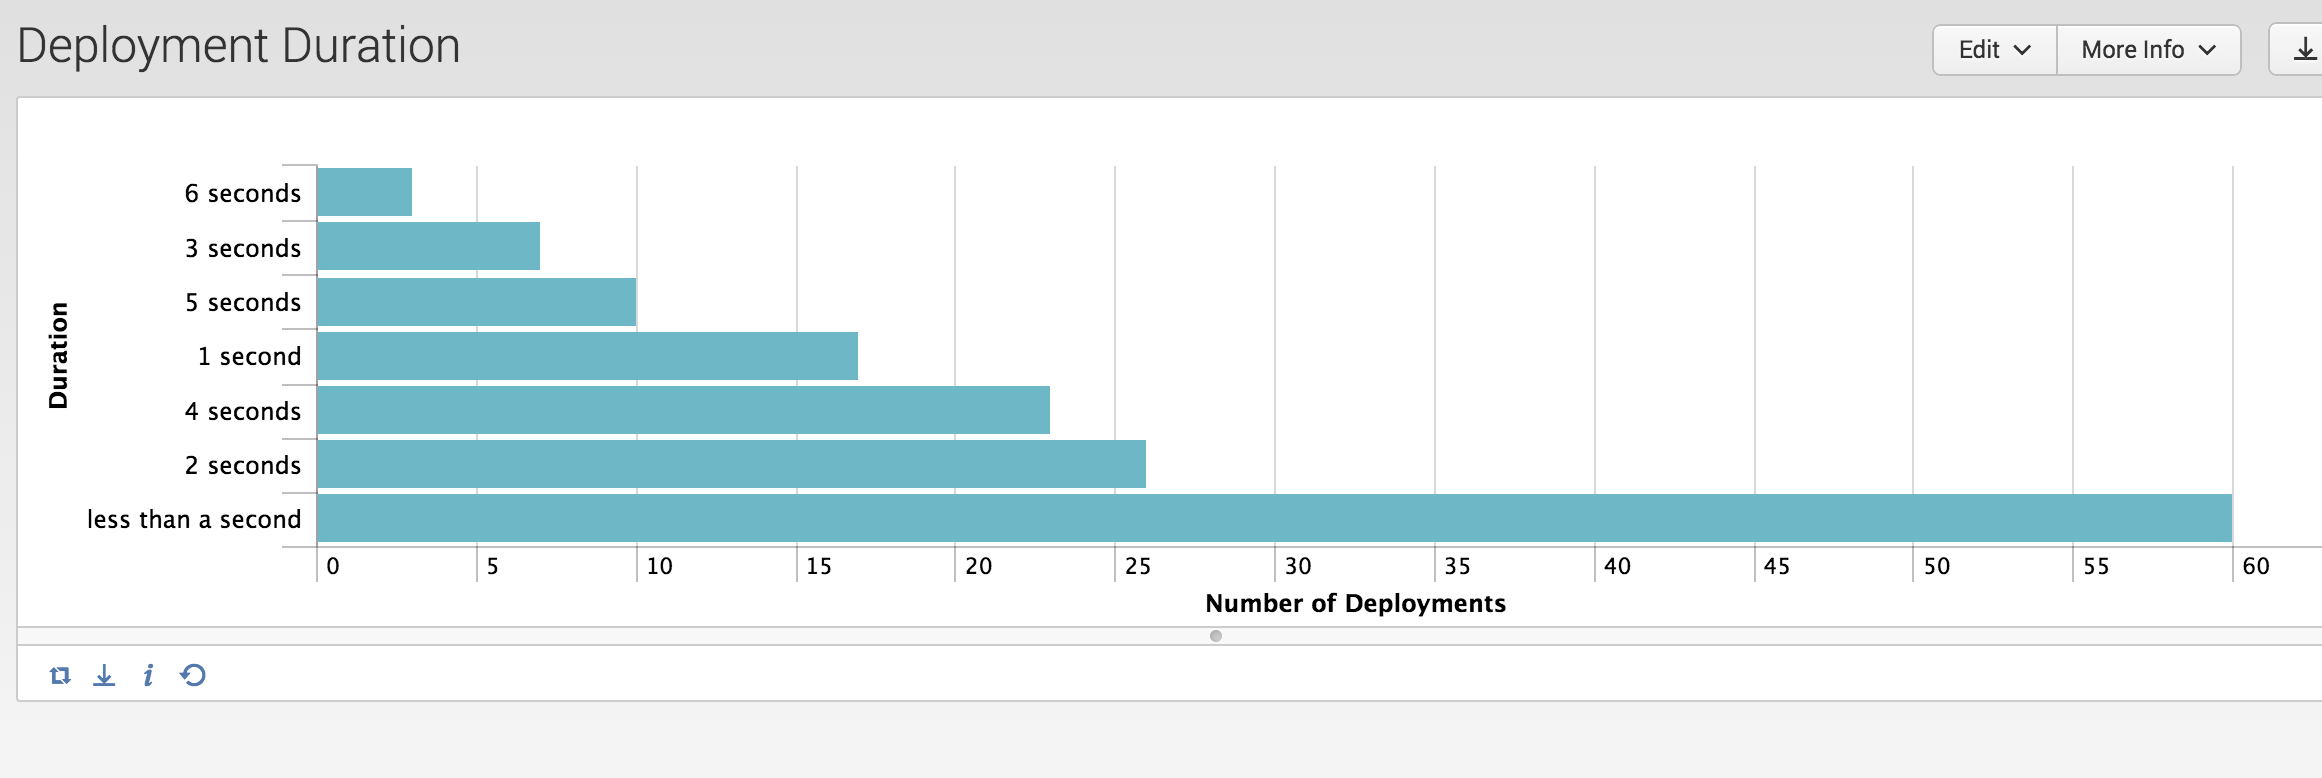
These are quite simplistic examples. Far more insight is possible when you are correlating log information from you applications on premise, in AWS or Azure (maybe using Serilog).
Using this deployment information, along with versions of code and errors via structured logging allows a realm of opportunity and understanding of your systems.
The code is up on GitHub and I soon hope it will be available from Splunk Base along with a new app with some nice dashboards. Thanks to Glenn Block and Hal for their pointers.